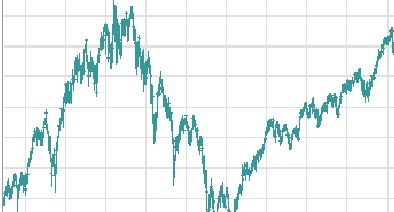
S & P Index, Weekly, 10 Years, Ending June 22, 2007

Bear Market >>>………..Bull Market>>>
In any conversation or discussion of investing, we will eventually get around to talking about “THE MARKET”. Every newscast reports on how THE MARKET is doing at the moment or how it did today or yesterday or last week. There are TV programs, radio programs, magazines, books, brochures, consulting firms, advisors, and analysts all devoted to talking about THE MARKET and especially trying to figure out what THE MARKET is going to do tomorrow, or next week or next month or next year. What is this market everybody seems to be so interested in? There are of course many different kinds of markets, that is, places where products or services are bought and sold. There is a “market” for every different kind of investment opportunity we may wish to consider. There is a market for antiques, for paintings, for gold, for commodities, for government securities, for real estate, for collectibles, for you name it. Once a week there is a “farmers market” here in the town where I live where local farmers and aggressive gardeners bring produce to sell to the rest of us who like to eat really fresh vegetables and the like.
However, THE MARKET reported on the evening news usually refers to the DOW, the NASDAQ, and/or the S&P. These are all measures of performance in the stock market. The DOW is an abbreviation for the “Dow Jones Industrial Average”. It is an average of the stock prices of 30 of the nation’s strongest, largest, most prominent, successful, well established, well known stable companies. The NASDAQ, is an abbreviation for the “National Association of Securities Dealers Automated Quotations System”. NASDAQ is a computerized system that provides brokers and dealers with price quotations for stocks traded over the counter (as well as some that are listed on the New York Stock Exchange). The S&P is an abbreviation for the Standard and Poor’s 500 Index”. It is a weighted index of the value of the 500 largest companies traded on the NY Stock Exchange. There are many other market indexes and as you can see here, they actually deal with only a particular segment of the total stock market. Although there are many thousands of stocks that make up the entire MARKET, Dow Jones publishes the “Wilshire 5000”, an index most experts consider to be the best overall description of total market movement.
The chart shown above is that of the S & P 500 Index over a ten year period on a weekly basis. I stole this chart from the CNN Money website. All market indexes will tend to have this general shape but won’t move exactly together. When prices are moving upward, all will tend to move upward. When moving downward, they will all tend to move downward.
During this period, the S & P reached a high of 1527.46 on March 24, 2000. But it fell to a low of 776.76 on October 9, 2002 before it started back up. The period during which the S & P fell is called a “bear” market. You have all heard this term. Picture a great big grizzly bear raised up on his/her hind legs with front legs/paws/claws outstretched in front of you ready to squash you (push you down into the ground). That’s why this is called a bear market. The bear is raised up and pushing the market down. However, this bear market is followed by what we call a “bull” market. You have no doubt heard this term too. Picture a bull with his head down and horns thrust forward ready to gore you and lift you up and throw you over his back. That’s why this term is used. The bull is lifting the market upward. Enough trivia.
I know what you are all thinking. Boy-o-boy, this is sure easy. We just buy into the market at the bottom and sell out at the high. Well, let me just remind you that what we have been looking at here is past history. There are thousands (maybe millions) of people who are trying to figure out/predict/project/guess what THE MARKET will do (how it will perform) in the future. There is a huge industry devoted solely to this task and these people are all really smart people. They study, they analyze, they develop mathematical models, they chart, etc. My son (a really smart guy) worked with a man who seemed to do very well trading stocks. After many questions and discussions he (my son) wrote computer program (he is a brilliant programmer) that modeled this man’s decision making process and used this really great computer program to lose $10,000. The moral of this story? NOBODY (with one exception of course) KNOWS WHAT THE MARKET WILL DO TOMORROW OR NEXT WEEK OR NEXT YEAR.